This is the work behind some stats I posted in another thread, but I thought it deserved a seperate discussion to avoid going off topic. This post is written in two sections. The first section is the method I used to get my statistics, for those who are interested, or who want to check if I’ve got it right. The second section is just the results – if this is all you’re after, then please skip to the end.
------------------------------------------------------------------------------------------------------------
SECTION 1 – HOW I DID ITKeep it Simple, StupidI started off by looking at running. That starts off fairly simple – you roll one die, with an equal chance of getting each result (1/6, or 0.167 – I’ll stick to 3 decimal places for fractions, but I’m using as many as MS Excel keeps in its memory). To get the “Expected” result (the mean average), you multiply each result by the probability of getting it, to find that the average result for 1D6 is 3.5.
FleetNext I looked at Fleet. By choosing to re-roll the die if it comes up less than a certain number, you reduce the probability of getting values equal or below that number, and increase the probability of getting values above that number. I ran the maths for re-rolling anything below a 6, then below a 5, and so on. The results are illustrated on the graph below:
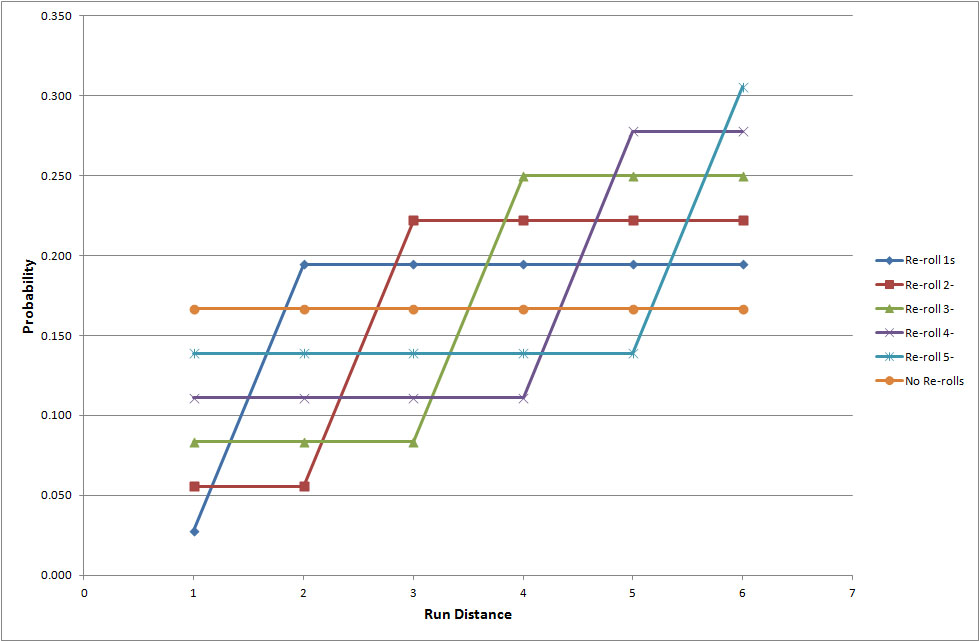
This in itself is not terribly useful, until you check the Expectation, which gives the following:
| Re-Roll | Expectation |
| No re-roll | 3.500 |
| 5 or less | 3.917 |
| 4 or less | 4.167 |
| 3 or less | 4.250 |
| 2 or less | 4.167 |
| 1s | 3.917 |
So any re-roll gives you a better run on average than no re-roll, but to get the best chances (statistically speaking), you should keep 4+s, and re-roll anything else. That’s actually fairly intuitive, but it’s nice to have the maths to back it up. For the rest of the post, I will only consider using Fleet in this way, rather than multiply the sums over and over.
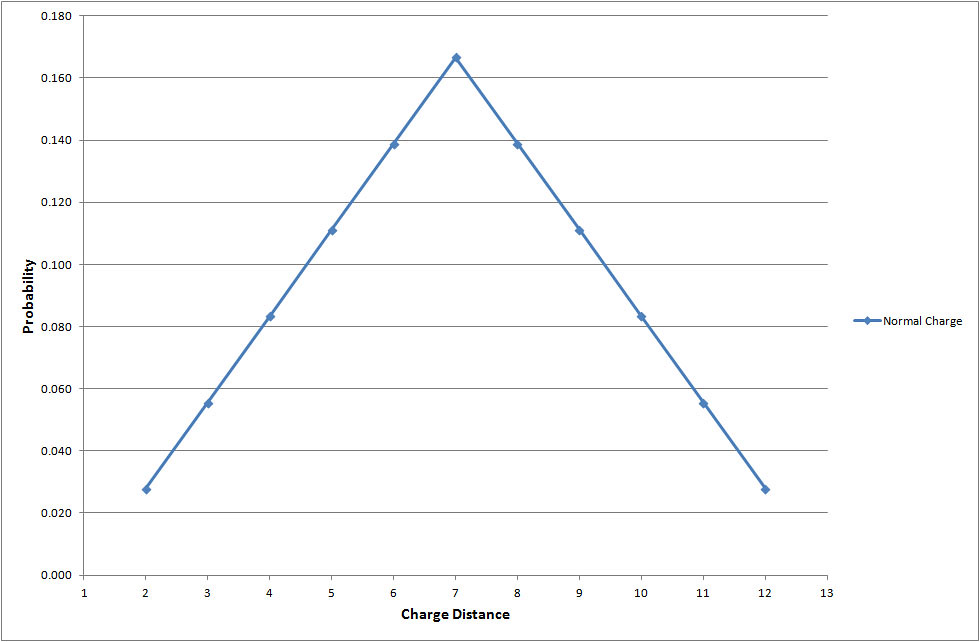
ChargingThe random charge of 2D6” is only marginally more complicated than a run of 1D6”. Because the results are not equally likely, we now have a mode average (the most common result) as well as the mean Expectation. Because the probability distribution for 2D6 is symmetrical, the mode and the Expectation are both 7.
 Charging Through Cover
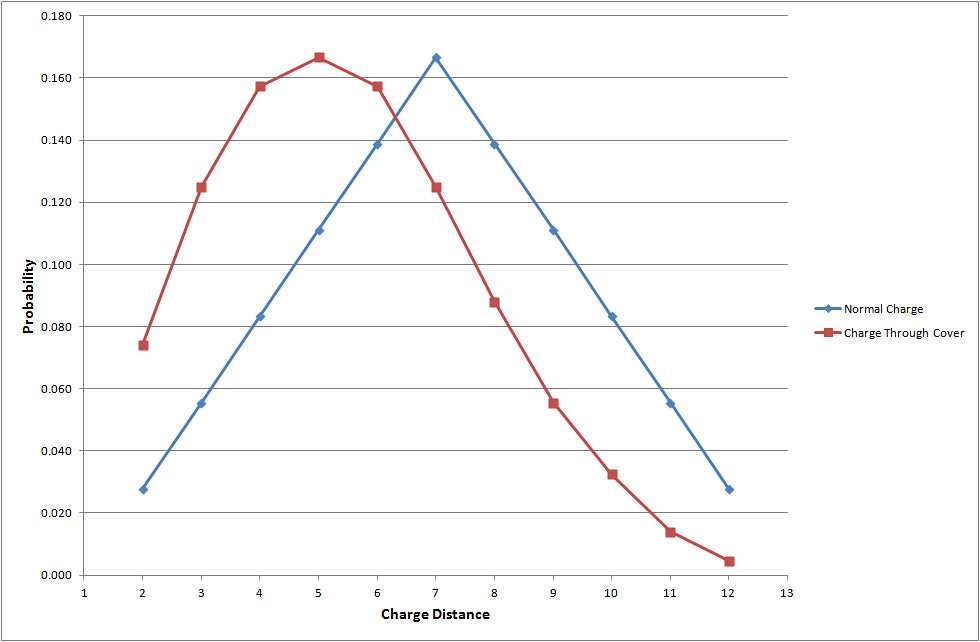
If you charge through cover, things get more difficult. Although there must be a more elegant way to do the sums, I approached it by writing out all 216 possible combinations on 3D6 in Excel. By summing the 3 results and subtracting the highest [=SUM(A1:A3)-MAX(A1:A3)] I created a Totals column that gave me the result once the highest value was discarded. Counting the number of times each result appeared and dividing by 216 gave the probability of each, which I then plotted. 5 is now the most common result, but because the graph is not symmetrical, the average charge through cover is actually 5.542”
 Charging and Fleet
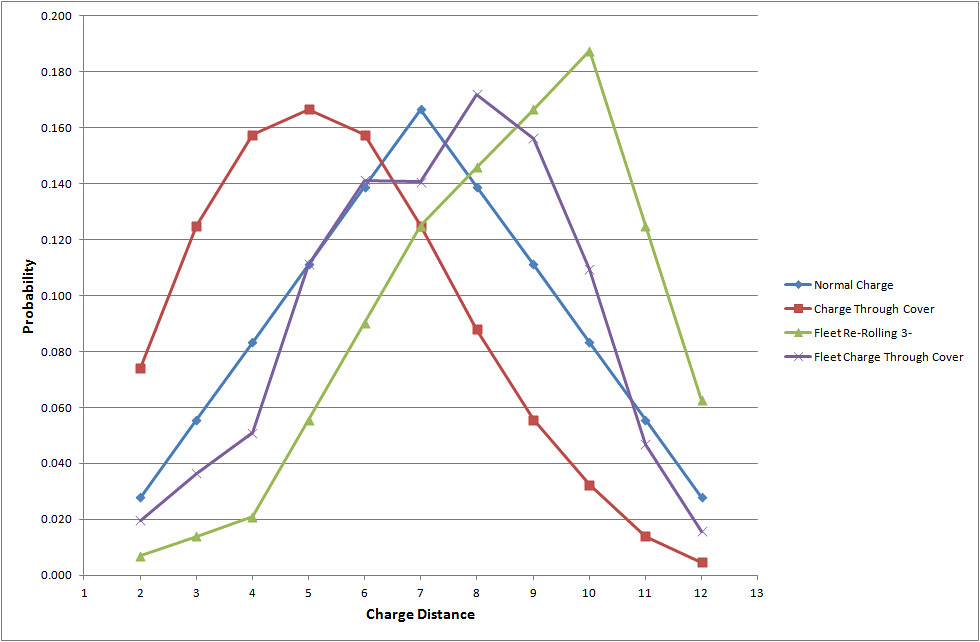
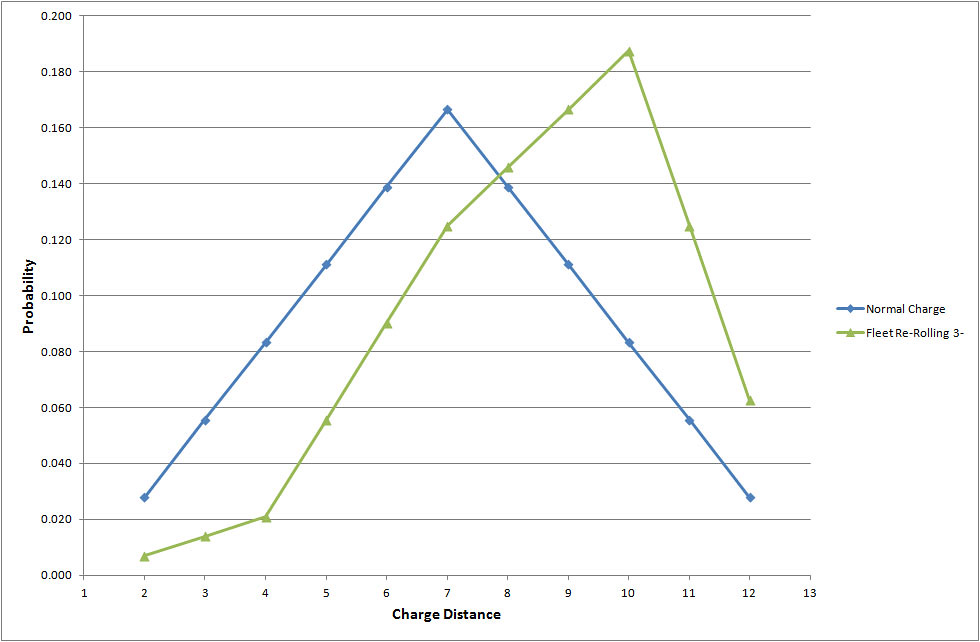
Ignoring cover again, I returned to Fleet, and looked at the effect that would have on charging. As with the last example, I took each possible result in turn, but this time I used the revised probabilities that re-rolling anything below a 4 gives instead of the equal probabilities of a single roll. This skews the distribution to the right, making the most common result 10”, although the average sits a bit lower, at 8.5”
 Fleet Charges Through Cover
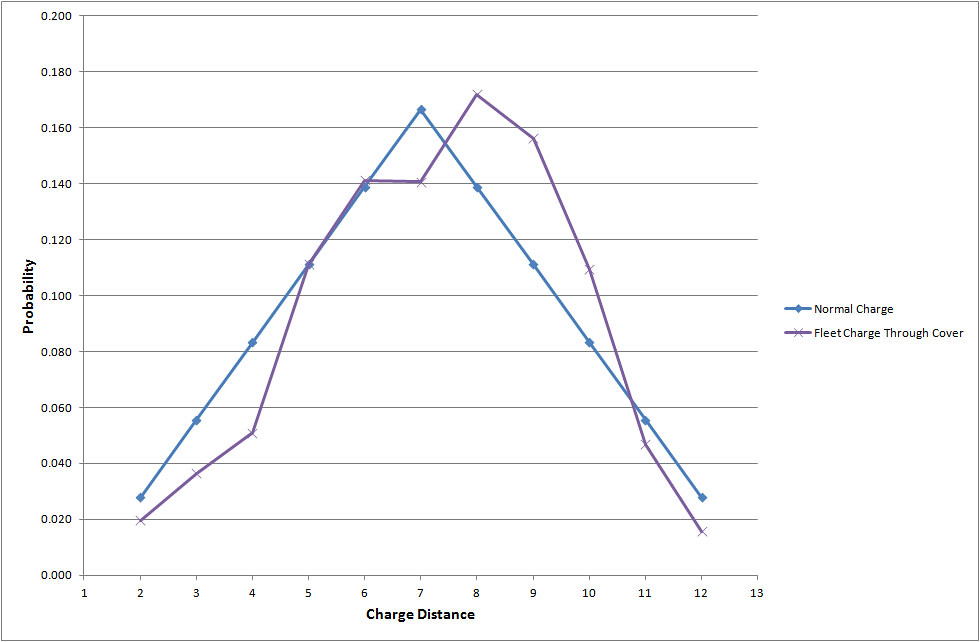
I combined the two previous methods to address the most complicated case. For each of the 216 individual cases for 3 dice I calculated the probabilities when considering re-rolls. I then added the probabilities for each numerical result and plotted. In this case, the most common result is 8”, even through cover, although the average is only just better than a standard charge without cover, at 7.318”.
------------------------------------------------------------------------------------------------------------
SECTION 2 – THE RESULTSA quick summary then:
If you are Fleet, the best results on average come from keeping 4+s and re-rolling everything else. This increases your average run from 3.5” to 4.25”, and your average charge from 7” to 8.5”.
If you are not Fleet and you charge through cover, your average charge falls from 7” to just 5.542”. If you are Fleet, your average charge remains just above 7”, at 7.318”
All of the probability distributions for charge distances are given below:
